View Traceability
View QMetry test cases, test steps, executions, and linked issues for a Jira work item directly in Jira. You can also trace requirements and issues in QMetry by using the Traceability report.
Prerequisites
Before you begin, make sure of the following:
The Jira administrator has enabled the Jira project for integration with your QMetry instance.
The Jira project is mapped to a QMetry project, its work item types are mapped to QMetry modules.
You have authenticated Jira in QMetry.
Authenticate Jira in QMetry
To authenticate Jira in QMetry, do the following:
Go to Integrations.
Find your Jira Integration.
Click the Cog icon and select Configure.
Enter the Jira credentials.
About the QMetry Panel
The QMetry panel appears as the QMetry section on Jira work items that are synced with QMetry.
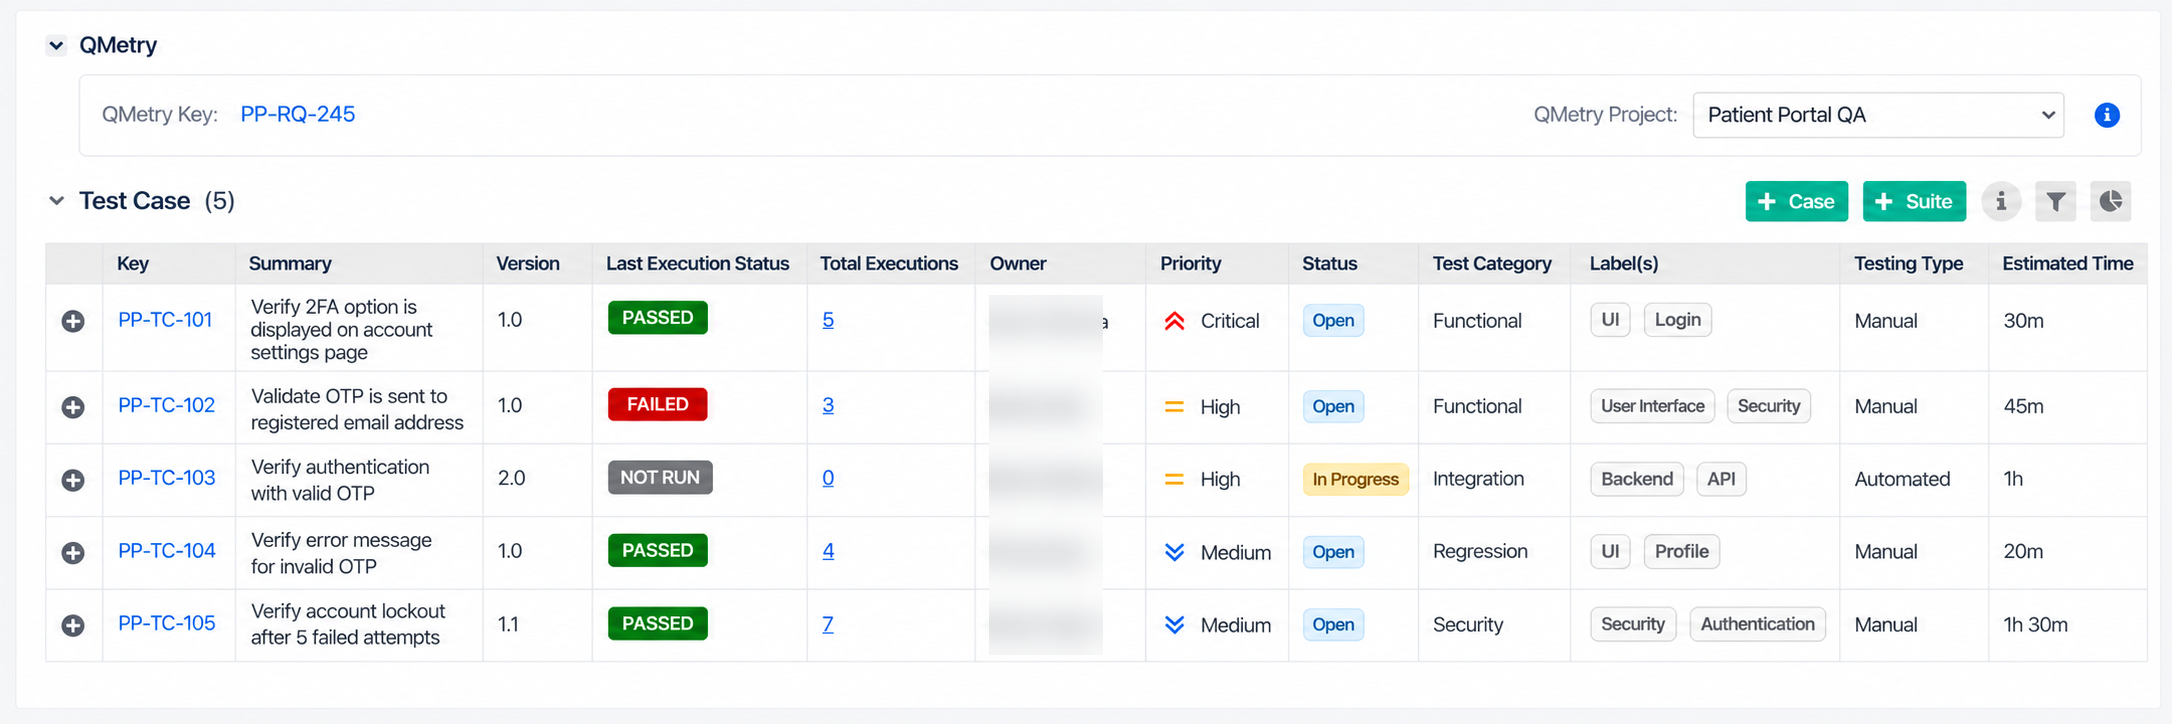 |
The panel shows the following information:
QMetry Key: the key of the QMetry requirement or issue that the work item is synced to in the selected QMetry project. The key changes when you select a different project.
QMetry Project: the QMetry project to show data from. If the work item is synced to more than one QMetry project, select the project in the list.
Test Case: the test cases linked to the work item.
Note
The panel shows data only from the QMetry instance that the Jira project is linked to.
View Test Cases Linked to a Story
When a Jira story is synced to QMetry as a requirement, the QMetry panel shows the test cases linked to that requirement.
To view the test cases linked to a story, do the following:
Open the Jira story.
In the QMetry panel, in the QMetry Project list, select the QMetry project.
Review the test cases in the Test Case section.
To view a test case's steps and executions, expand its row.
Each test case row shows the version linked to the requirement. Last Execution Status shows the most recent execution of the test case, whichever version was executed. Total Executions shows how many times the test case was executed. Click the count to open the Executions tab of the test case view.
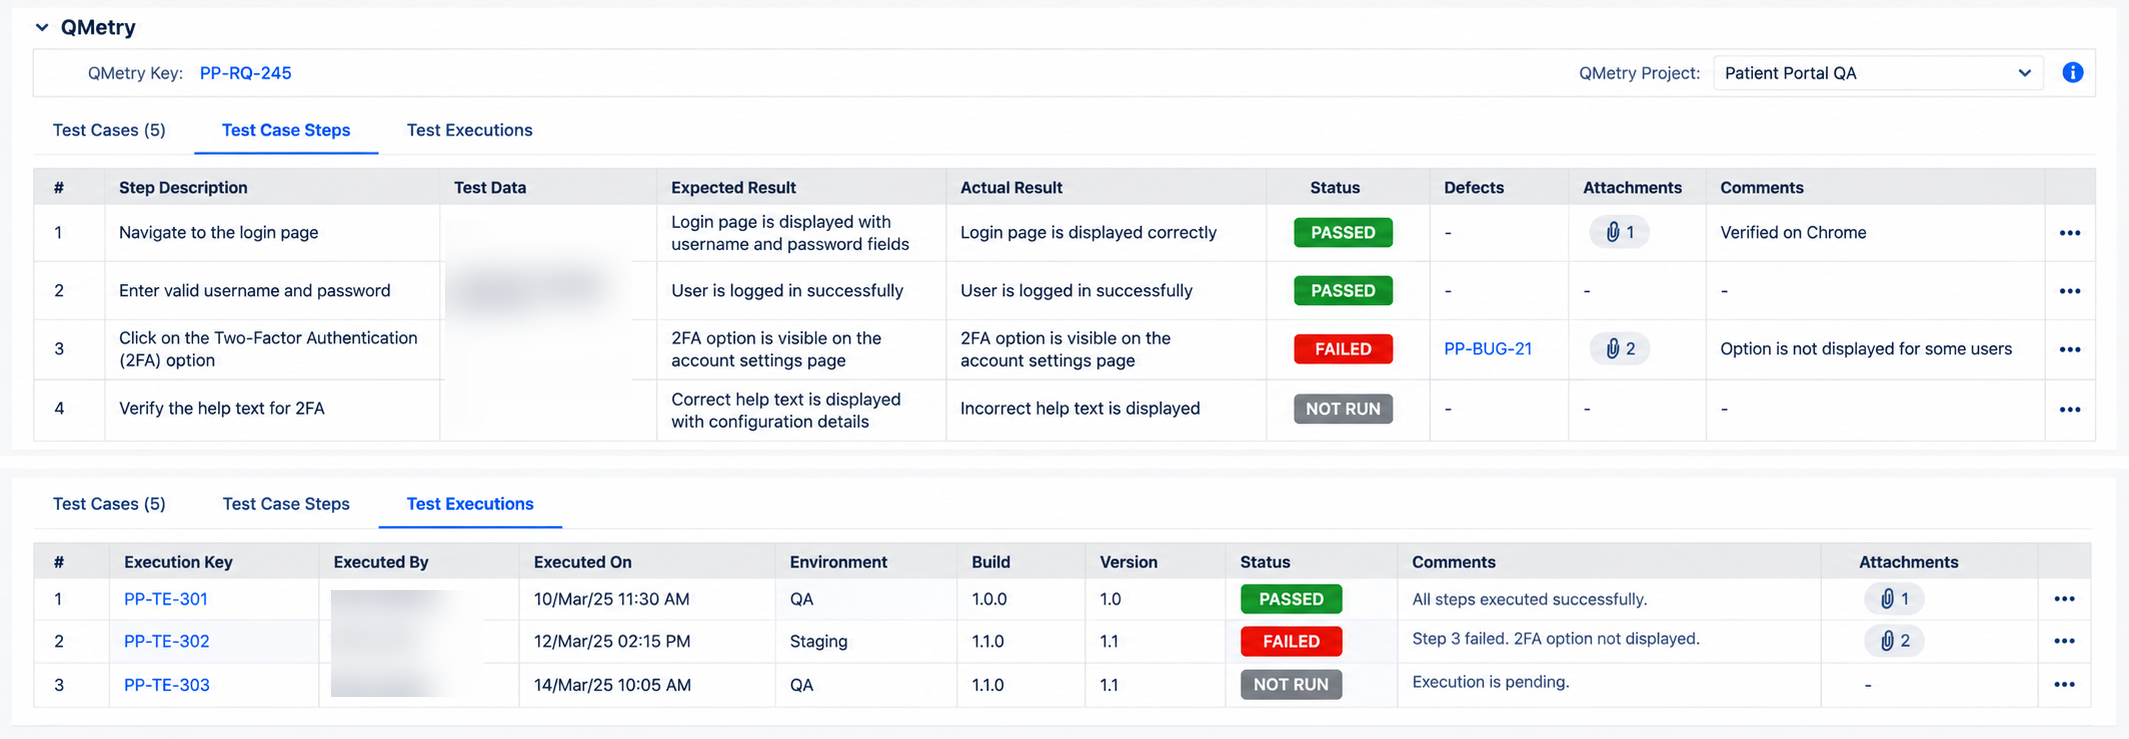 |
Tab | Description |
|---|---|
Test Case Steps | The steps of the test case version linked to the requirement, with all their system fields and user-defined fields. The fields appear regardless of how test step columns are arranged in the QMetry Test Cases module. |
Executions | One row for each combination of test suite, release, cycle, platform, and executed version (E.V.). Executions of all versions of the test case are shown, not only the version linked to the requirement. |
The number on each tab shows how many steps or executions the test case has.
To view more details on the Executions tab, click the following:
Test suite key: opens the test suite in QMetry.
Issue count: opens the Issues dialog box. To open an issue in Jira, click its key in the External Key column.
Attachment or comment icon: shows the number of attachments or comments for the execution. Clicking the number opens the Comments and Attachments dialog box showing more details.
Note
If an issue is linked directly to a test case and not to an execution, the Executions tab shows no execution details.
View Test Cases Linked to a Bug
Product owners, developers, and testers can see the test coverage and execution status of a story directly in Jira, without opening QMetry.
Developers and testers working on a bug can see in Jira which test cases or test steps found it, and how those tests ran, without opening QMetry.
When a test case fails during execution, you can raise a bug from the Test Suite Execution screen in QMetry. QMetry creates the bug in Jira and shows its Jira key as the external key of the issue in QMetry.
 |
To view the test cases linked to a bug, do the following:
In QMetry, open the issue, and click its External Key.
In Jira, scroll to the QMetry panel.
Review the test cases in the Test Case section.
To view a test case's steps and executions, expand its row.
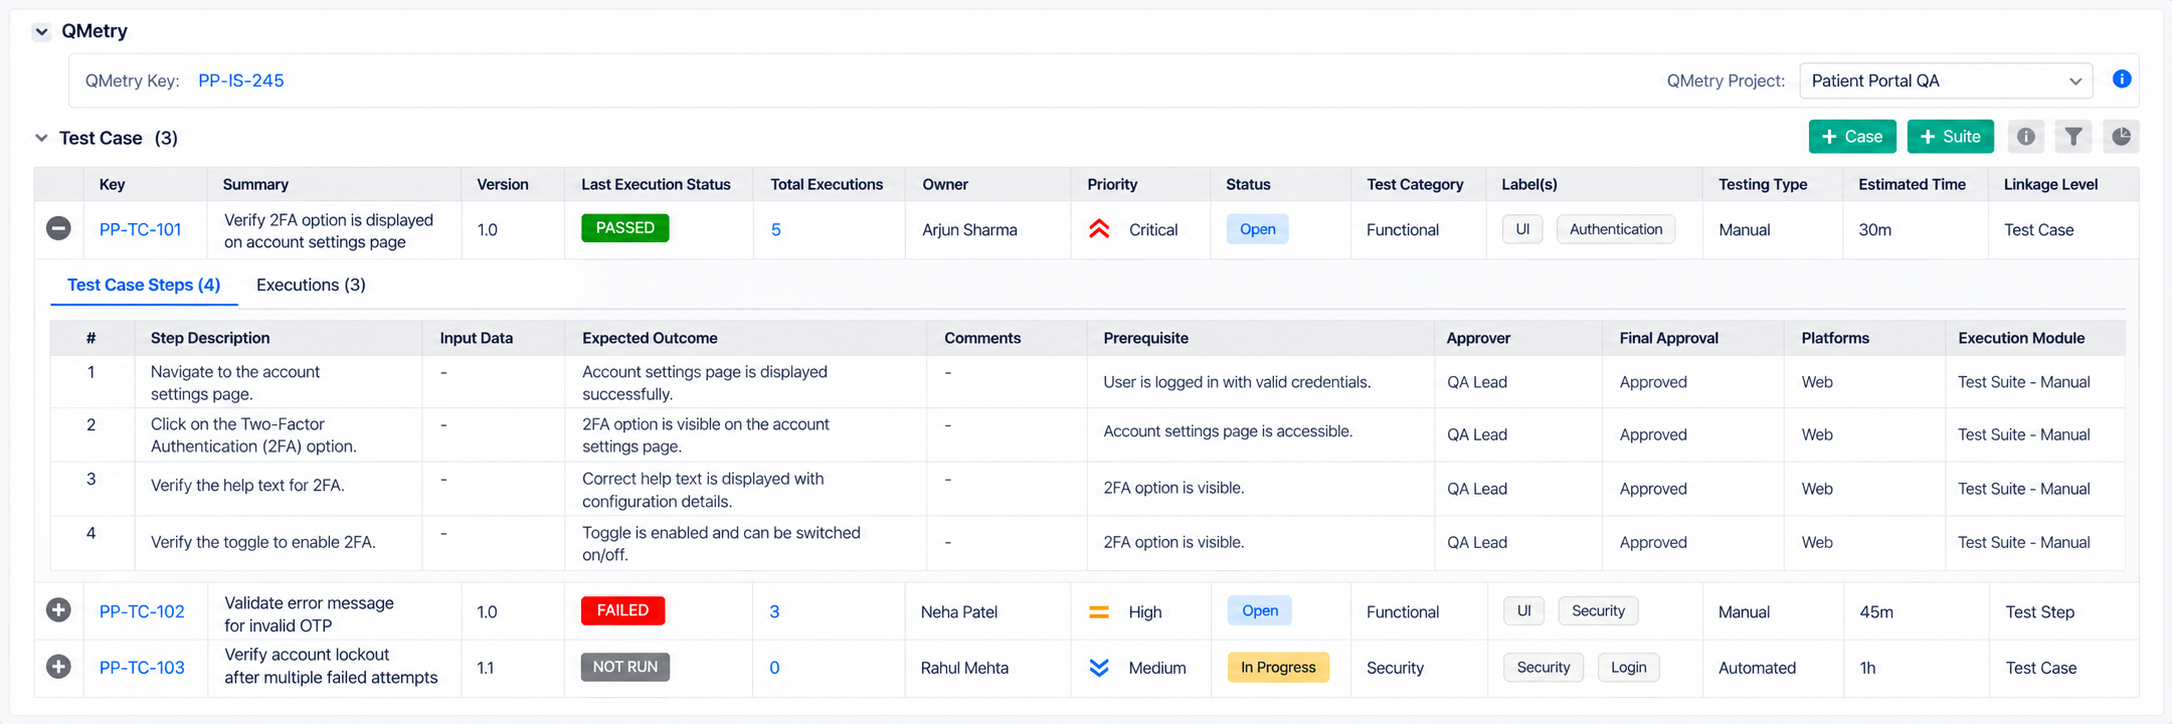
The panel on a bug has the same columns and expandable rows as the panel on a story, including Total Executions.
The Linkage Level column shows whether the bug is linked to a test case or to a test step.
Open the Test Case View
The test case view shows full details for a test case without leaving Jira. To open it, click a test case key in the QMetry panel.
The test case view has two tabs.
Executions
This tab lists the test suites in which the test case was executed. To view an execution's steps, issues, attachments, and comments, expand its row, or click the related count. To open a test suite in QMetry, click its key.
In the list, S.C. is the step count, and A.T. is the actual time taken for the execution.
If an issue is linked directly to the test case and not to an execution, this tab shows a message instead of execution details.
Test Case Details
This tab shows the system fields and user-defined fields of the test case, its test steps and attachments, and an execution status summary.
Linked Issues in Jira
Bugs linked directly to a requirement in QMetry appear in the Linked issues section of the Jira story.
BDD Panel in Jira
When a version control system is configured for the QMetry project, the BDD panel appears on Jira stories synced as requirements:
Editing: edit BDD content in Jira. Changes made in Jira appear in QMetry, where the BDD panel is read-only for requirements imported from Jira.
Project list: if the story is synced to more than one QMetry project, the QMetry Project list shows each project that has version control configured. All of these projects are on the linked QMetry instance.
To push BDD changes, do the following:
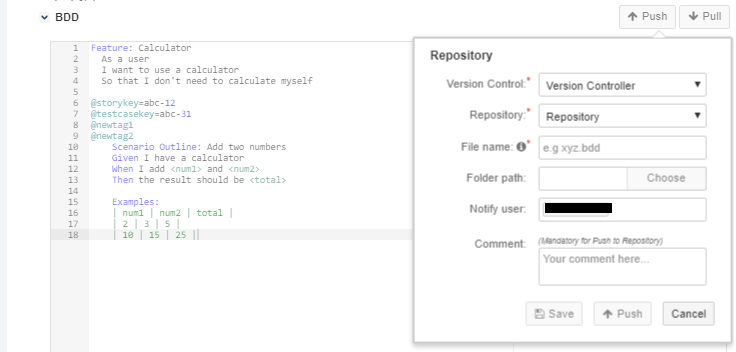
In the QMetry Project list, select the QMetry project.
In the Version Control list, select the version control system.
In the Repository list, select the repository.
Make your changes, and click Push.
Your changes apply only to the selected QMetry project.
To pull the latest BDD content from the repository, select the QMetry project, version control system, and repository, and click Pull.
Traceability in QMetry
To trace requirements or issues in QMetry, do the following:
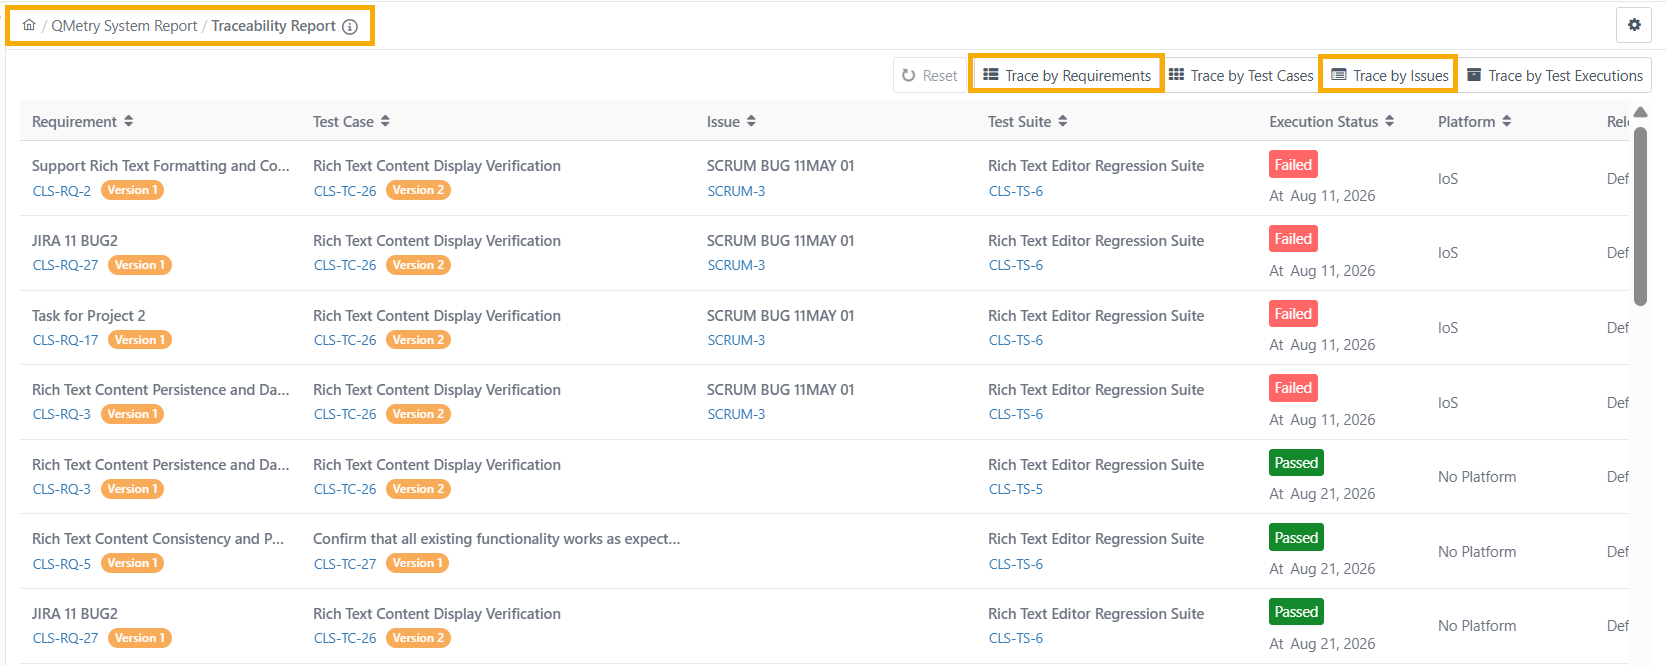
Go to Reports, and select Traceability Report.
Select Trace by Requirements or Trace by Issues.
Select the entity, and click Apply.